Understanding crime statistics is one of the clearest ways to evaluate public safety across Texas. The Texas Department of Public Safety (DPS) releases annual data that tracks violent crimes — including murder, rape, robbery, and aggravated assault — in cities across the state. By looking at the rate of these offenses per 100,000 residents, we can see which cities have the highest concentration of violent crime and compare larger urban areas with mid-sized communities.
Texas Cities with the Highest Violent Crime Rates
The table below ranks Texas cities with populations over 100,000 by their violent crime rate per 100,000 residents. This information comes directly from the 2023 DPS Crime in Texas Report and reflects the most up-to-date statistics available.
Each column shows how a city compares not just overall, but by offense type — from homicide rates to aggravated assaults. This breakdown allows residents, policymakers, and visitors to see where crime is concentrated and what types of crime are most common in each city.
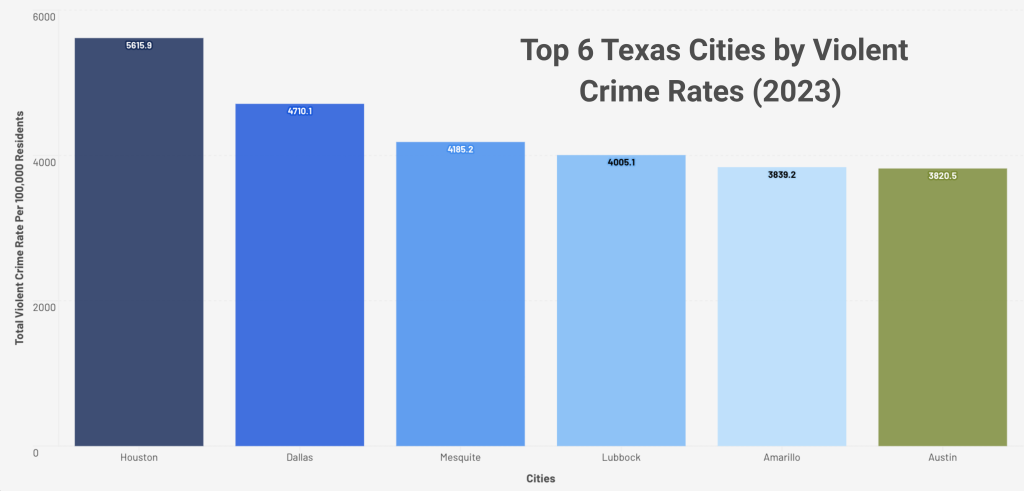
For example, Houston and Dallas report some of the highest total numbers of violent crimes, while smaller cities like Lubbock and Amarillo often record higher per capita rates of aggravated assault. On the other end of the spectrum, cities like Frisco, McKinney, and Sugar Land remain on the lower end of violent crime rates despite rapid growth in population.
| City | Population | Murder | Rape | Robbery | Aggravated Assault | Total Violent |
|---|---|---|---|---|---|---|
| San Antonio | 1,490,047 | 10.9 | 98.7 | 121.5 | 470.4 | 6,184.40 |
| Pearland | 127,433 | 1.6 | 18 | 22.8 | 63.6 | 1,776.60 |
| College Station | 126,136 | 3.2 | 48.4 | 17.4 | 88.8 | 1,494.40 |
| Brownsville | 190,590 | 4.2 | 23.6 | 58.2 | 305.9 | 2,429.8 |
| Allen | 114,696 | 8.7 | 20.1 | 9.6 | 71.5 | 937.3 |
| Frisco | 228,527 | 0.4 | 16.2 | 11.8 | 57.3 | 1,448.0 |
| McKinney | 212,716 | 2.4 | 18.8 | 11.3 | 72.9 | 1,015.9 |
| Plano | 291,140 | 1.0 | 31.6 | 33.0 | 95.8 | 1,828.7 |
| Carrollton | 134,261 | 4.5 | 23.1 | 26.1 | 112.5 | 1,649.8 |
| Dallas | 1,304,989 | 18.5 | 36.3 | 157.6 | 458.4 | 4,710.1 |
| Garland | 240,051 | 4.2 | 34.6 | 60.0 | 131.6 | 2,614.9 |
| Irving | 255,203 | 5.1 | 53.7 | 70.5 | 173.2 | 2,757.0 |
| Mesquite | 147,926 | 3.4 | 37.2 | 103.4 | 367.8 | 4,185.2 |
| Richardson | 119,008 | 3.4 | 16.8 | 39.5 | 65.5 | 2,150.3 |
| Grand Prairie | 205,487 | 1.9 | 27.7 | 23.8 | 135.3 | 1,788.4 |
| Denton | 155,215 | 5.8 | 52.8 | 34.1 | 154.6 | 2,442.4 |
| Lewisville | 133,694 | 6.0 | 41.1 | 37.4 | 135.4 | 2,006.1 |
| Odessa | 111,922 | 6.3 | 38.4 | 44.7 | 306.5 | 2,189.9 |
| El Paso | 676,665 | 5.0 | 40.8 | 48.0 | 242.2 | 1,969.7 |
| Sugar Land | 108,718 | 2.8 | 11.0 | 30.4 | 28.5 | 1,358.6 |
| League City | 115,791 | 3.5 | 25.9 | 13.8 | 70.8 | 1,331.7 |
| Houston | 2,304,406 | 14.9 | 61.1 | 295.7 | 720.0 | 5,615.9 |
| Pasadena | 145,850 | 7.5 | 90.5 | 91.2 | 433.3 | 3,405.6 |
| Edinburg | 106,137 | 1.9 | 76.3 | 28.3 | 192.2 | 2,483.6 |
| McAllen | 145,684 | 4.8 | 35.7 | 24.0 | 79.6 | 2,095.6 |
| Lubbock | 267,406 | 6.0 | 84.5 | 132.0 | 626.8 | 4,005.1 |
| Waco | 145,741 | 8.2 | 84.4 | 67.2 | 347.9 | 3,167.9 |
| Midland | 135,253 | 5.2 | 63.6 | 33.3 | 328.3 | 2,324.5 |
| Amarillo | 201,684 | 7.9 | 81.3 | 101.1 | 533.5 | 3,839.2 |
| Tyler | 110,824 | 9.9 | 76.7 | 37.0 | 310.4 | 2,601.4 |
| Arlington | 394,799 | 4.1 | 71.9 | 59.0 | 350.8 | 3,070.4 |
| Fort Worth | 973,722 | 8.7 | 68.1 | 71.0 | 340.1 | 3,142.6 |
| Abilene | 128,387 | 4.7 | 86.5 | 48.3 | 303.8 | 2,177.8 |
| San Angelo | 98,642 | 5.1 | 38.5 | 26.4 | 213.9 | 2,906.5 |
| Austin | 978,816 | 6.7 | 50.3 | 93.3 | 348.8 | 3,820.5 |
| Laredo | 256,542 | 3.9 | 50.3 | 33.5 | 338.0 | 1,807.9 |
| Wichita Falls | 102,740 | 3.9 | 94.4 | 61.3 | 331.9 | 2,983.3 |
| Round Rock | 129,898 | 1.5 | 28.5 | 19.2 | 87.8 | 2,295.6 |
What the Numbers Mean
- Houston and Dallas dominate in raw numbers: As the two largest metro areas, they record the highest totals, particularly for robberies and assaults.
- Mid-sized cities can look more dangerous by rate: Lubbock and Amarillo, though much smaller, rank higher when measured per 100,000 residents.
- El Paso continues to stand out for safety: Despite being a large border city, El Paso consistently shows one of the lowest violent crime rates among major Texas cities.
- Suburban growth matters: Fast-growing suburbs like Frisco, McKinney, and Pearland generally report lower violent crime rates, underscoring differences between urban cores and newer suburban communities.
Why This Matters for Texans
Crime statistics do more than rank cities — they highlight where public safety resources are most needed and help families make informed decisions about where to live, work, or travel. For policymakers and law enforcement, these numbers are vital for allocating funding, building prevention programs, and strengthening community policing.
For residents and visitors, understanding which Texas cities have the highest violent crime rates adds context to news stories and personal experiences. It also emphasizes the importance of viewing crime data per capita, rather than just looking at raw totals.
Sources and Methodology
All figures in this chart are drawn from the Texas Department of Public Safety’s 2023 Crime in Texas Report (Crime by Jurisdiction). Rates are calculated by dividing the total number of offenses by each city’s population, then multiplying by 100,000 to allow for fair comparisons between cities of different sizes.
Frequently Asked Questions About Crime in Texas
What is the most dangerous city in Texas?
According to the 2023 Texas DPS Crime in Texas Report, Houston consistently records the highest number of violent crimes overall. However, when comparing per capita rates, mid-sized cities such as Lubbock and Amarillo often rank higher for aggravated assault. This shows that “most dangerous” depends on whether you’re looking at raw totals or crimes per 100,000 residents.
Which city in Texas has the lowest crime rate?
Among large cities with populations over 100,000, suburban communities such as Frisco, McKinney, and Sugar Land generally report the lowest violent crime rates. These cities continue to grow rapidly while maintaining relatively low levels of violent crime compared to Texas’s urban centers.
How often is Texas crime data updated?
The Texas Department of Public Safety (DPS) releases updated crime data every year in its Crime in Texas report. The most recent report available covers the year 2023. Because data is based on police department reporting, annual releases are considered the most reliable way to track trends.
Is Dallas or Houston more dangerous?
Houston typically reports the highest total number of violent crimes, driven by its size and population. Dallas also ranks high, particularly for robberies. Per capita rates, however, can vary by category. For example, Amarillo may have a higher assault rate than both Houston and Dallas despite being much smaller.
Why does El Paso rank lower in violent crime?
El Paso is often recognized as one of the safest large cities in the United States, not just Texas. Despite being a border community, El Paso’s violent crime rate remains low compared to other major metros. Experts attribute this to strong community ties, effective law enforcement strategies, and cross-border cooperation.
Why are crime rates reported per 100,000 residents?
Using per capita rates makes it possible to compare large cities like Houston or Dallas with mid-sized communities like Lubbock or Amarillo. Without this adjustment, big cities would always appear “more dangerous” simply because they have more people.
What crimes are included in violent crime statistics?
Violent crime includes four main categories: murder, rape, robbery, and aggravated assault. Property crimes such as burglary, theft, or auto theft are tracked separately and are not part of the violent crime totals.
If you or a loved one has been impacted by violent crime in Texas, don’t face the aftermath alone. Contact an experienced Houston criminal defense lawyer today for a free consultation and learn how they can protect your rights.